05 May Architecting the Built Environment of Data
A lot of people ask how we, as architects—building architects that is—came to data visualization. If you understand what architects do, what we do with data is directly analogous.
If you think about it, architects don’t build buildings, we make pictures of them. So one of the byproducts of an architectural training is an expertise in graphical representation. In fact, when I went to architecture school everyone had to have a book called Graphic Standards—around 1000 pages—each paper thin like a Bible—that describes how to represent all things related to the built environment so that building owners and contractors (like plumbers, electricians, roofers, carpenters) and the myriad vendors involved with the building process would be able to understand and act on the information.
So, the way that architects use different kinds of drawing conventions like plans and sections and axonometric and perspective—these are used to explain or communicate the various conditions of the building. And this is exactly what we do with data: we articulate conditions in data—you can think of visualization as different slices and perspectives of a dataset—so that human beings can understand and act on them.
Designing with data—infographics, visualization, decision support or whatever term suits your fancy (data-driven user experience is mine)—is inherently a right and left-brained competency involving creative and analytic processes—just like the design of buildings. The architect designs for a set of programmatic needs, but the building must stand up and withstand environmental conditions. But, ultimately the architect ensures the right experience of the building—is it beneficial to human needs and goals?
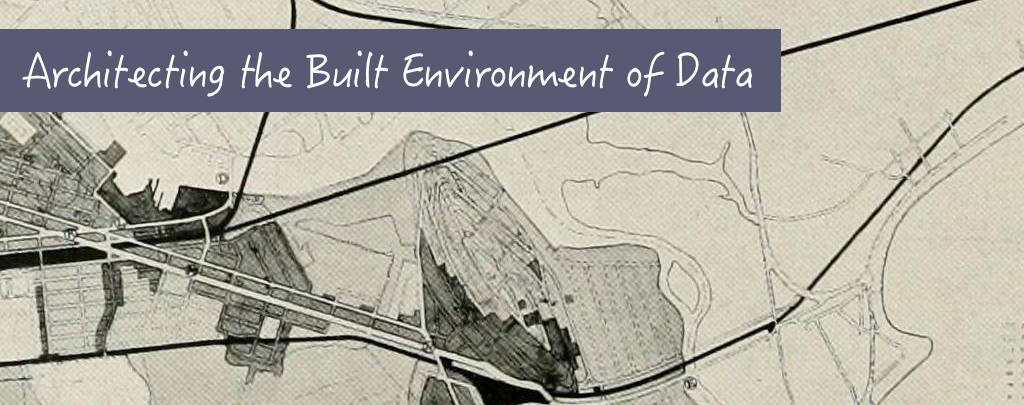
This is the approach we take to the challenges we see in the age of Big Data. But beyond the design of a single user interface into a dataset—like the design of an individual building—there is the design of the surrounding neighborhood and city supporting those pieces. We have some infrastructure and certain utilities for data available to us, but what is the built environment of data going to look like? Are we headed here (Washington DC, Daniel Burnham’s 1901 design):

Or here? (Kowloon’s Walled City, demolished in 1993, where lack of regulation enabled 33,000 people to build over and live within the space of one city block):
