02 Jul Fitting It All In: Designing For Complexity Within Interactivity
Zillow can be an interesting site to explore. While it’s always been a source of data for property values and such, recently they’ve been expanding their scope into quantifying and displaying more of the the human aspects of places. Tucked away in the “Local” tab on Zillow is an interesting interactive map of K-12 school rankings.
To me, the format is the most interesting part. They did a great job of keeping an overwhelming amount of data from being visually overwhelming for the user. The scheme seems simple: every school gets a bubble that contains its 1-to-10 Greatschools rating, and the bubble is color-coded to show whether it’s in the low (1-3), middle (4-7), or high (8-10) range. However, these bubbles take up a lot of space on the map, and there are a lot of schools to show. To stay legible, the bubbles have to stay the same size and can’t scale like the other features of the map do when you zoom.
This was a design problem, and the solution that Zillow has offered is an interesting one.
It starts with a presumption of how the map will be used. Mainly, that people want to find the very best schools for their children, so the highest-rated schools get the highest priority. This narrowing of focus immediately makes it easier to make decisions about how to lay out the information. One simple but clear manifestation of this general rule can be seen in the bubbles’ interaction: wherever they are forced to overlap, the bubbles are stacked in order of rating, with the highest rating on top.
While this rule imposes some order and clarity onto the map, it’s not the main way that they keep from being too many bubbles to see through. For a map with another purpose, it might be good enough to just see the bubbles, foregoing the context. The purpose of this map, however, is to find a home in an area with good schools. If the user can see the ratings but can’t determine what location they’re tied to, then the information isn’t very useful.
This is where things get more interesting, because the design of the map gets a whole lot more subjective: they start throwing out the data. Strategically, of course!
Each level of zoom displays a certain level of data. If we call the closest zoom level Level 1, things start falling off at Level 8. You can see most of the city, but any school with a rating of 1 (or NR, for Not-Rated) disappears.


Zoom out to Level 9 and all the red disappears because anything rated 5 or lower has been removed.

Zoom out again to Level 10 and the red returns, but many of the bubbles are gone. This is because the bubbles now represent districts, not individual schools, and the ratings are an average. Additionally, each district is shaded and has its boundary shaded with the color of its rating.

Zoom out to 11 and the red is gone again as any district with an average of 4 or less disappears.

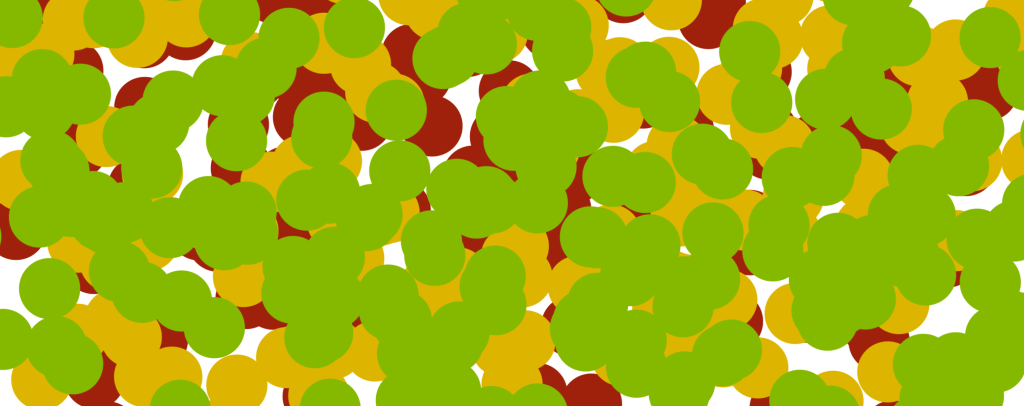
Zoom out to 12 and the yellow almost disappears as well. Any district rated less than 7 is gone, as well as the shading of green districts.

Zoom out to 13 and only 9’s and 10’s remain.

So what does this progressive filtering do? For one, it clears up the clutter of what would otherwise be a very crowded and busy map, and makes it very simple to identify where the better-rated schools are. If every school’s bubble remained even at the furthest zoom level, all that would be visible of the map in the background would be the Atlantic Ocean. It’d be a little unfair to expect non-maritime users to get their bearings with only the shape of the coastline to go on! All in all, a pretty effective way of communicating what needs to be communicated.
Nick Mahlburg