25 May UXPA Boston 2017: Takeaways
The 16th Annual User Experience Conference (UXPA) was held on May 19, 2017 in Boston, Massachusetts. Over 1000 designers, researchers, managers and developers were in attendance, including our design team at GroupVisual.io. Presentation topics ranged from designing for accessibility to optimizing data visualization, and choosing which concurrent lectures to attend was quite the challenge. Our designers Luis Sandoval, Lisette Peña and Erin Gwozdz give their key insights and takeaways from the event.
EG: I never regret going to design events, and my experience at UXPA was no different. More than just a break from the daily grind, events like UXPA give you access to the brightest design thinkers in the community, show you new ways of approaching problems, and revitalize your passion for design.
LP: There’s benefit even when speakers are reinforcing concepts you already know. For a designer early in my career, it’s reassuring to hear that the way I approach design and work through problems is consistent with that of industry leaders.
EG: Agreed. Especially when you’re a perfectionist! So, what were our favorite events?
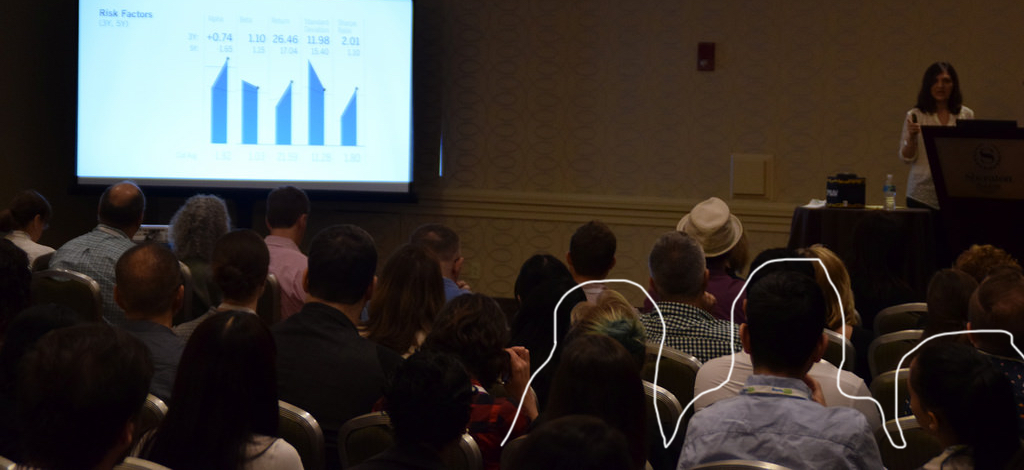
LS: The data visualization talk with Julie Rodriguez was great.
EG: That was definitely my favorite.
LS: But in terms of what most challenged my thinking, I’d go with “Designing in Healthcare for High Stress Situations”. They gave a scenario in which this feature release that they thought was great had completely failed. A father was frantically trying to access their child’s medical records during a life-threatening event, and couldn’t log on to the account. There was a language barrier and they couldn’t figure out how to reset their password. After this issue, the team realized that although they had tested and validated their designs, they took for granted the limited mental resources their users may be dealing with. To try and replicate the scenario, they surprised two team members and had them live action role play. Their simulation helped the team build empathy and identify their design shortfalls.
LP: I went to that one too. It put into perspective how user testing may not fully prepare you for real-life scenarios, since it often takes place in an artificial environment.

UX Spectrum from “Designing in Healthcare for High Stress Situations” by Katelyn Hurley and Rachel Roppolo
EG: I wish I could have heard that presentation! Lisette, were there any others that stood out to you?
LP: Ifat Yaakobi’s “Designing For Multitasking and Interruption-Intensive Environments” was another that resonated for me. The things she talked about — centralizing information, reducing the cognitive load of a workflow — were really applicable to a project I’m currently working on. I also liked hearing about the psychology around attention and multitasking.
EG: That sounds cool. Like I said, my favorite presentation was “Data Visualizations That Expand Your Visual Literacy” by Julie Rodriguez. I was really impressed by how her team was able to visually compress a large amount of data without sacrificing context and detail. I’ve seen a lot of data visualizations successfully employ the typical methods of visual encoding (color, intensity, area, length…) but not many that use angle and direction. Maybe that’s not totally fair, but I thought the way she reinforced data themes with angle and direction was so elegant.

Notes and scribbles taken during “Data Visualizations That Expand Your Visual Literacy”
LS: I agree, she showed some nice strategies for extracting themes and patterns. And how you don’t need to show everything up-front. It’s easier to grasp the story and navigate to points of interest when you start from an aggregated, macro level.
EG: Okay, so we all walked away with copious notes from a range of speakers. What’s one phrase or point that you wrote down that you’ll be revisiting?
LP: Shifting the center of the universe. “Your mobile app isn’t the center of your universe. The customer is the center of your universe.” (Bruce Ernst) and “You’ve got to start with the customer experience and work backwards to the technology.” — Steve Jobs.
LS: From the service design standpoint, avoid digital band-aids that don’t solve the root problems. Expand our mindset to shape the experience beyond the digital solution.
EG: “Tech savvy” as a user characteristic doesn’t mean much. How does the person actually interact with technology in their everyday life?