19 Sep Visual Data Input
People abandon surveys for a number of reasons. Too long. Too boring. Too in-depth. Typical survey tools offer a limited amount of complexity for data collectors. Common inputs are multiple choice, rankings and free-text. The problem with this mode of data collection is that the user has almost no incentive to wade through a multi-page survey. While the data collected is valuable for the business owners and analytics teams, raffles and other “rewards” for completion don’t discourage abandonment rates enough.

If we apply our understanding of user engagement to this process, surveys could be more interactive and gather better data. What if instead of a respondent ranking your services from best to worst, or rating their experience on a scale from 1 to 5, a user could draw their experience. Increasing a respondent’s interest in participation encourages more users to participate and finish the survey, adding value to the data you’re collecting. Humans process visuals 60,000 times faster than text, expediting the survey process. A more visual input is valuable to you, and interesting for a user to create.
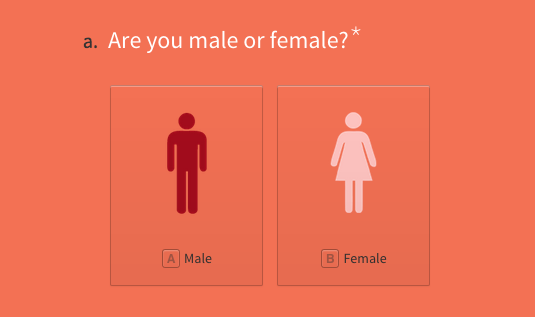
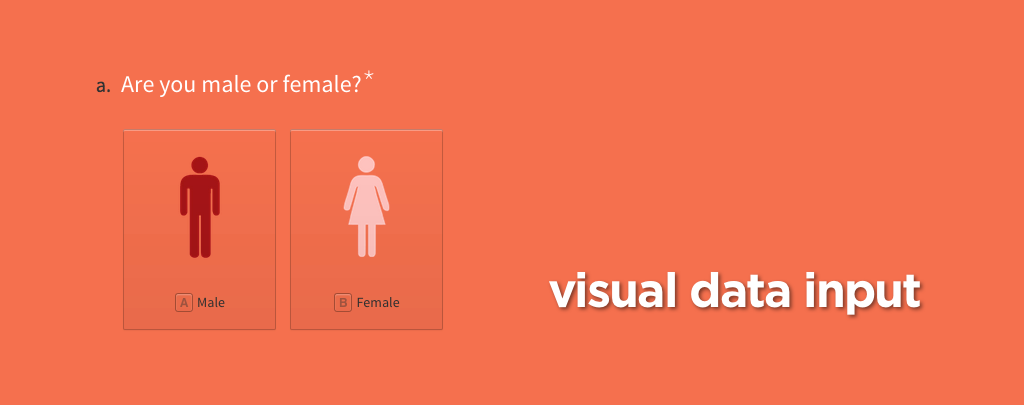
Typeform allows respondents to fill out the survey through images rather than just text.