09 Jun GVio Held Data Visualization Workshop
Mark Schindler, co-founder of GVio, and Bang Wong, creative director at Broad Institute, held a Data Visualization and UX Workshop at the Open Data Science Conference in Boston last week.
The focus of the workshop was to discover approaches to turn data into actionable insights, combining heuristics for visual analytics with techniques from user-experience design.
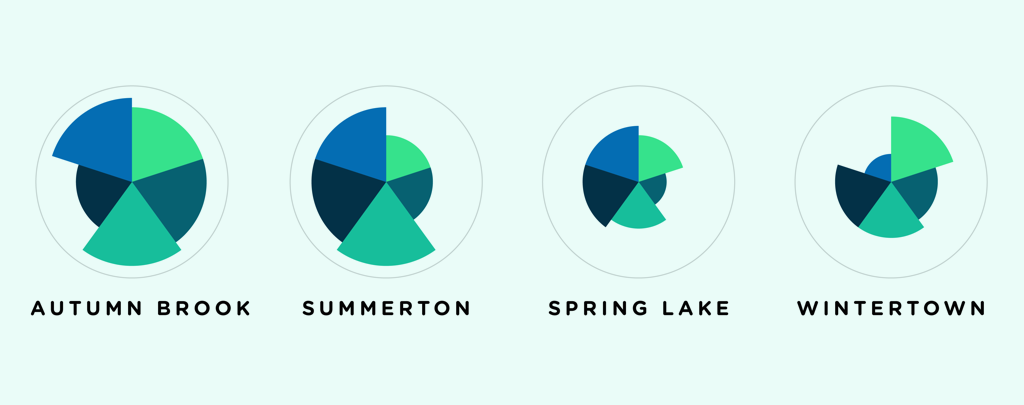
Participants learned how to choose and create data visualizations driven by user-oriented objectives, through presentations and an in-class exercise. The class exercise was conducted in small groups. Each group was given a sample of real estate data, and thirty printed sample charts visualizing that data.
During the workshop, participants brainstormed the major questions a user might have, and sought to determine the best ways to help a user make an informed decision. The challenge is that a user doesn’t just want the answer – they want a visualization that will help them to see the context.
For 30 minutes all of the groups worked on defining the questions, and finding or creating appropriate visualizations.

All participants were deeply engaged in the process. Some used their laptops and different data analytics tools.

Others used a pen and paper.

Four groups presented their results to the audience. All groups came up with different set of questions, different approaches and different answers.

If you missed the workshop you can play with the data yourself:
Workshop presentations, data samples, charts and additional resources
Ilya Sinelnikov
