02 May The Product Leader’s Guide to data-enabled decision-making
As a product leader, your focus needs to be on how to continually improve your product. Competitive challenges are likely a constant for you and your team. If you’re like many product leaders you also need to contend with alignment challenges within your team and keeping your stakeholders on the same page with your product strategy.
What are product analytics and why, with everything else you need to focus on, should you prioritize them? Simply put, it can make your life, and that of your team, a lot easier.
By effectively deploying product analytics, you can expect
- Lower stress, more fact-based decision-making
- Easier alignment among the team and stakeholders
- Higher-quality product outcomes
What are product analytics?
It’s the process of using data to understand how your customers are using your product, and how well your products and services are performing, with the ultimate goal of improving your product in some way. Product analytics is all about leveraging data to make better business and product decisions.
By tracking and analyzing user behavior, you can gain invaluable insights into what’s working and what’s not for your customer. For example:
- Getting a sense of where your customers are encountering roadblocks or confusion in your product
- Understanding which products and features are being used, and which are not
- Discovering ways to optimize performance and increase revenue
How can product analytics benefit product teams?
Understanding customer behavior
Say you notice that one of your product modules is only rarely being used. Yikes! Your team spent months designing and building it, and everyone involved believed it should provide value to your customers. In fact, the reason you built it at all is because several of your customers requested it.
Why is product usage low? Your team has a few hypotheses:
- Maybe the navigation link to the module is too hard to find
- Could it be that something is broken in its workflow, making it impossible for people to use it properly?
- Perhaps the content is loading too slowly and people are giving up
- Could it be that users tried it, and didn’t find it as useful as we thought?
- Or maybe the feature only appeals to a subset of our user personas…
Which hypotheses are correct?
This example is only one of many questions a product team might ask, to understand how well their product is performing with their users and customers, and why things might not be going as they had hoped.
A well-planned product analytics scheme will offer answers to these kinds of questions, as well as to many questions the team may never have even thought to ask.
Improving the product experience
Every time your team puts out a product release they naturally expect it to be better than the last one. Your customers do too. What happens when you put out a release and customers dislike it, or usage actually goes down?
You’ll probably have many questions. Wouldn’t it be nice if you had a place where the answers could be found?
Even better would be if you could have answers to those questions before your team invested in designing and building the new release.
Making informed product decisions
Each product decision– to add or modify a feature, to reorganize the product’s navigation, to put new functionality behind a paywall – is based on one or more assumptions. An assumption might be:
- If we reorganize the product’s navigation, it’ll be easier for users to find what they need
- Putting a piece of new functionality behind a paywall will increase upgrades to premium tier subscriptions
If your team is like a lot of others, you may discuss those assumptions. But do you confirm the assumptions are true before investing in building it? Product decisions are often made because someone important asked for it, or the team seemed to think it was a good idea, maybe based on customer feedback.
But what if you could identify the assumptions that go into each important decision and validate those assumptions are correct before you build? Then, when you release it, you can track usage patterns to confirm your customers’ behavior is following what you expected. Or if you see unexpected behavior, you have data to help tell you why. This is how product analytics can improve a team’s decision-making.
A/B testing
Your team has identified a customer need and wants to build a new product feature. Great. How should the feature work? In fact, almost any requirement can be satisfied in a variety of ways.
Your team has a couple different options. Which one is best? This is where A/B testing comes in.
What is A/B testing, exactly? At its core, A/B testing is a method for optimizing product design and functionality by comparing two versions of a product against one another. One group of users is given Version A, while another group is given Version B.
The goal is to see which version performs better in terms of user engagement, conversion rates, revenue, and other key metrics.
Teams can A/B test with clickable mockups or paper prototypes. Or they can do it by actually building two different versions and deploying each to different users, then analyze which performed better.
Mockups & prototypes
A/B testing with mockups is a good way to go if a feature is difficult or expensive to build.
The process typically involves creating a non-functional clickable prototype– a set of pictures hyperlinked together, so someone can click through it as if it were a working product. Each screen mockup can look just like a real product screen, but it doesn’t have all the code to perform like a real product. A good clickable mockup is convincing enough that a user can imagine how it would work in reality, and hence give good feedback on its design.
It’s hard, though, to do mockup testing with a large number of testers, since it generally involves manual work to run subjects through the test.
Building different versions
If you have a product with a high volume of users and your team feels that a lot hinges on an A/B decision, it may be worth actually building and putting out multiple versions of a feature. Then you can see what user behavior ensues with the different versions. This will give you more valuable data than a mockup test, since it’s tested with real users on a real product. To accomplish this, however, you’ll want high-quality product analytics to capture useful data about which is working better.
Identifying product opportunities
Product changes usually get made when someone identifies an opportunity or requests a modification. But what if there are opportunities to significantly improve your product, only nobody’s thought of them yet?
Although no one may have noticed that there’s a way for your product to be easier to use, or more profitable, those insights can often be extracted from high quality analytics.
How? Let’s say you have a premium feature in your product that offers users more detailed reporting, along with trend charts and comparison to norms. To get access to this feature, your customers need to upgrade from the basic version. How will you entice them to upgrade? If you offer a 15-day trial of your premium tier, you ideally want them to:
- Try out the premium feature
- Use it enough to find it valuable
- Upgrade so they’ll continue to have access to it
Enter product analytics. A good clickstream analytics tool might identify proactively, for example, that people are having trouble finding your premium feature. Maybe they’re clicking on things that look like links, but don’t take them where they expect. With this knowledge, you can redesign the page so more people successfully try it, the result being more upgrade revenue.
Common problems, and how product analytics can help solve them
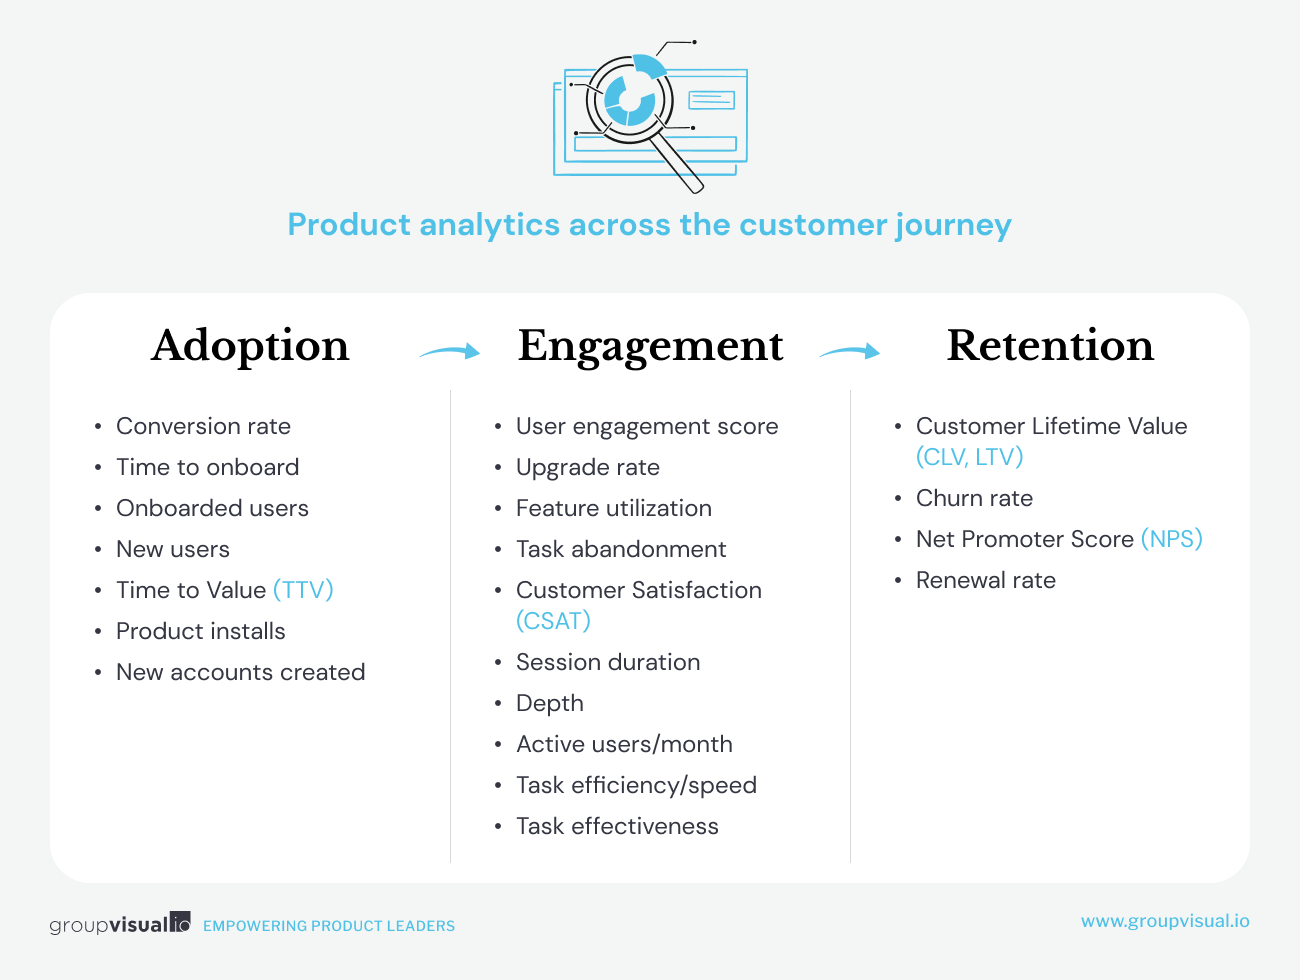
Product analytics across the customer journey
Onboarding / activation challenges
Nobody expects to have to go through training to learn how to use a digital product. And yet many business-to-business (B2B) tools require lengthy onboarding for new customers, often involving time-consuming training sessions. This puts a barrier between your customer and the value they get from your product.
Unfortunately perhaps for B2B product organizations, customers now expect the same kind of easy onboarding for professional tools that they experience with consumer products. At most that might involve a quick sequence highlighting key product features with instructional overlays, tooltips or coach marks.
What to do if your product requires more skills in order to use effectively? This is what’s known as a ‘time to value’ or TTV challenge. Time to value is a measurement of how long it takes a new customer to realize value from your product. If they have to go through training before using your product, or work hard to figure it out, TTV will be long.
A better product strategy is to determine as best you can what your new customer is hoping to do right away, and help them accomplish that task. They may not learn immediately all the other things your product can do, but that’s ok. At least you helped them get to value quickly for an initial task, and they’ll probably want to come back.
Product analytics can help you understand if your customer is getting to value quickly enough, and can offer you ideas on what to do if they’re not.
Lackluster customer engagement
Once a customer has tried your product, you typically want them to continue using it and derive more value from it. That’s called an engaged user. Most product analytics tools, like Hotjar or Pendo, should be able to give you some sort of customer engagement score, to show how well you are doing keeping your users engaged.
But what if you find that too many of your customers are poorly engaged? This is where, along with user data, some psychology comes into the picture. An engaged user is one who has gotten into the habit of using your product. What does the science of habit-formation tell us? Well, new habits don’t form right away. It takes doing something multiple times for it to eventually become a new habit.
The behavioral designer Nir Eyal has a concise way of explaining how products can successfully cultivate habitual usage. Known as the Hook model, Eyal explains how stickiness can arise from dopamine-based reward cycles, and provides a blueprint for product teams to “manufacture desire by guiding users through a series of experiences designed to create habits.”
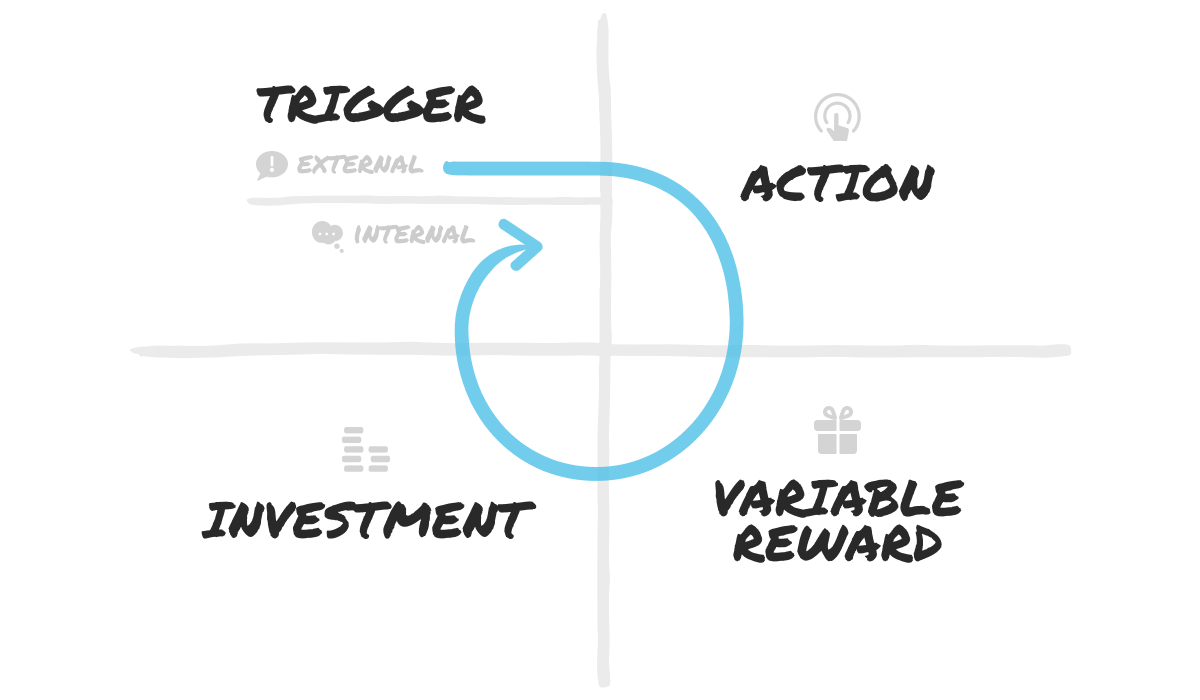
Social apps like Pinterest make effective use of Eyal’s Hook Model. When you receive a notification that someone has pinned a new image (the Trigger) and tap it (Action) you receive a Variable Reward (lots of interesting images). If you repin, save or share an image you are deepening your Investment in the platform. Enjoy doing this enough times and you will want to open Pinterest even without being prompted. Your External Trigger has become an Internal one.
User engagement break-down
User engagement can break down, though, when an experience doesn’t offer them enough reward. This can happen when:
- There’s not enough variety in the Variable Reward. You see the same thing every time and it gets boring.
- You’re exhausted by getting too many notifications, or they don’t feel relevant to you.
- The product doesn’t offer you good opportunities to deepen your Investment. You see something interesting, but there’s no way to save or share it within the platform.
- Perhaps competing products are offering more compelling ways to get you to open their product, or more interesting rewards when you do.
Product analytics can help you identify a customer engagement problem in your product, and pinpoint what might be causing the problem. This is invaluable to help product teams know how to fix it.
It’s important to note, by the way as Eyal does, that the Hook model can be misused to manipulate users into harmfully addictive behavior, as can occur with social media feeds. He proposes product leaders ask themselves two questions to help determine whether they are producing engagement that is truly in their customer’s interests:
- Would I use the product myself?
- Will the product help users materially improve their lives?
Here’s a nice article on how to ensure your team applies engagement techniques like the Hook Model responsibly.
Poor user retention
A poorly engaged customer is bad enough. One that quits your platform is much worse.
What might be causing people to “churn” or abandon your product? Some reasons can be:
- You’re targeting the wrong customer with your offering
- Your customers are not getting the value they expect
- Your competitors are doing a better job of satisfying their needs
How do you know which of these is causing your problem? Good product analytics should help you figure it out. The main thing you’ll want to understand is what is different about the people who churn, compared to those you retain? Or, put another way, what user behaviors on your platform seem to correlate to churn? For example:
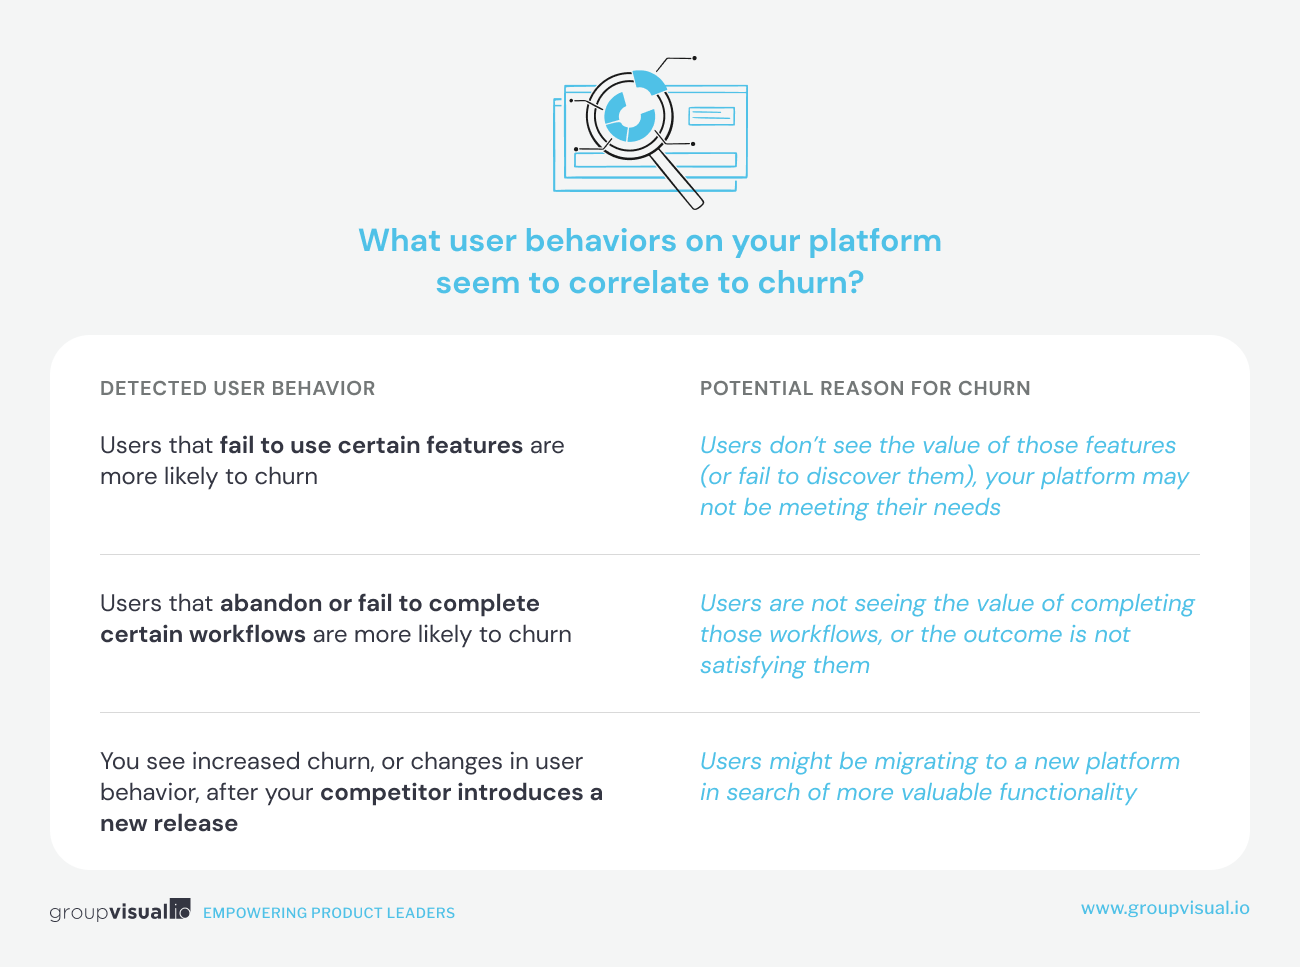
For any of these, further customer research or surveys should be able to help you more fully understand what’s going on and why.
How to decide what to measure?
Focusing on outcomes, not output
In his book, Outcomes Over Output, Josh Seiden argues that product decisions provide value when they’re aligned with business goals, and suggests that when outcomes guide the work of a team, their decisions help achieve those goals.
But what is the difference between an output and an outcome?
An output could be:
- How many product releases your team accomplishes per quarter
- How many new features your team ships in a particular release
- How many story points of tech debt your team has extinguished
Nothing wrong with measuring metrics like these, but on their own they don’t directly drive business value.
Seiden defines an outcome, by contrast, as a measurable change in human behavior that drives business results. A desirable outcome might be:
- Increase in the percentage of customers that successfully onboard
- Quicker time to fully onboard
- Higher average time on the platform, per customer
- Improved conversion rate for upgrades
- Reduced churn
What you measure depends on your goals
So, what are your business goals? And how do those business goals translate into what you want your customers to experience and feel, and how you want them to behave?
A product with an ad-supported business model, for example, is profitable when customers spend time viewing content and consuming ads. This generates a higher number of ad impressions on the platform. Improved customer engagement will be a key outcome, then, if you want users to spend more time on the product.
On the other hand, if your product’s revenue is driven by people upgrading to a paid or premium level, you probably want to look at which feature usage in the free version correlates to upgrade behavior. Understanding that, you can prioritize trying to engage your free users on those features, knowing that if you are successful in motivating them to use those features routinely, it should increase the likelihood they’ll level up.
More on an outcome-based approach below.
How to get started with product analytics (or level up your maturity level)
Product analytics MVP (minimum viable product)
If you’re not sure where to start, start simple, or free. We see many teams begin by setting up Google Analytics (GA) on their product. At the very least, you’ll get an idea of how many people are using your product, which pages or modules they’re visiting and maybe how much time they’re spending there. You’re also building a baseline against which you can compare your product’s performance over time. That’s way better than nothing.
Some more sophisticated product analytics tools have free versions that can give you some metrics beyond what Google Analytics offers.
Keeping in mind the outcomes that support their organization’s business goals, teams would do well to consider the top questions they might want to get answered about their product. Questions like:
- How are our Customer Satisfaction (CSAT) scores trending over time?
- How many new onboards do we have, per month?
- What % of our users are upgrading to our paid tier?
- What % of our customers successfully renew?
Then set up the analytics to answer as many of those questions as possible from the outset.
Intermediate
After your product analytics have been running for a while, you can start to ask more probing questions. What are the basic stats telling you? What customer behavior are you seeing? If you see a drop in CSAT after a new release, your team will want to know why. What questions can you ask to understand that? What correlations are you seeing between user behavior and their satisfaction with your product?
It may be worth conducting a workshop with your team to identify or clarify your goals. How does your goals translate to the customer/ user behavior you desire?
What are the gaps between what you’re seeing, and what you would prefer to see?
Advanced
After you have tracked trends and established a baseline for your product’s performance on key outcome metrics, you can start experimenting. If a feature hasn’t been working as well as you like, perhaps it’s worth rolling out a different version of it, and A/B test to see the effect on customer behavior. Which one is working better?
Engaging your team into a hypothesis-driven mindset can be hugely beneficial in product decision-making. A/B tests can be the first step to introduce the value of using product analytics to test an assumption or hypothesis. A team process could look like:
- Conduct a workshop to elaborate the organization’s business goals
- Convert those goals into a definition of your product’s desired state. What outcomes or KPIs would you want your product to hit?
- Identify gaps between where your product is now, and your goal state.
- Then think of experiments you might do… “how might we” statements, to address the gaps you see in your product’s performance. Express the hypotheses that would need to be validated as true, to fix the gaps.
- Then identify and set up the analytics you’d need to evaluate whether the hypothesis is bearing out.
- Iterate
This way of working builds product team maturity– high-quality and sustainable product decision-making.
Are you a product manager or someone looking for more product leader insights like these? Join our Product Leader list
Common approaches to measuring success
HEART & Goals-Signals-Metrics
HEART
The HEART model has seen widespread adoption since it was created by Kerry Rodden, Hilary Hutchinson and Xin Fu on Google’s research team in 2015. Known primarily as a User Experience (UX) evaluation framework, it adopts a user (or customer)-centric perspective on how well a product is meeting their needs and expectations.
HEART is an acronym for:
- Happiness: A measure of user attitudes— how happy are people using your product?
- Engagement: A measure of user behavior— how often, intensely, or deeply are people using your product?
- Adoption: How many new users, or customers, are coming onto your product or platform?
- Retention: What percentage of your users remain active on your product over time?
- Task success: How quickly or efficiently are people able to complete their tasks?
Let’s take a look at the metrics used to evaluate HEART measures:
Happiness
Happiness is typically measured via user surveys, often very quick or informal ones
- Customer Satisfaction (CSAT)— a rating of how happy you are with your product experience
- Net Promoter Score (NPS)— a measure of how likely you are to recommend the product to others, seen by many as a more reliable and stable indicator of customer satisfaction and loyalty than CSAT because it indicates how willing you are to go out on a limb to promote the product to others.
- Perceived ease of use— how easy do you find this product to use?
Engagement
Although Engagement can be evaluated via surveys, it is more often and reliably measured by some combination of usage metrics
- Frequency of use— how often are users visiting?
- Duration of each visit
- Depth— How many pages or product modules does the user access, typically, per visit?
Adoption
Adoption can be evaluated at the product level, or at the level of a module or feature
- How many new users are coming onto the product, per week or month? Depending on the type of product, this can be measured by things like the number of new downloads, product installs or new accounts created.
- At the product module or feature level, it could be what percent of users have begun using a newly-introduced feature each month.
Retention
Retention looks at user behavior over time, and depends on how your team defines active users.
- Percent of users active per month (or other period).
- Since each individual user may follow a journey that begins with onboarding, to adoption, to being an active user for some period of time, it can be helpful to look at how long that active period typically lasts. Do your users typically stay with your product for, say, 1-2 years before leaving the platform?
- Are you seeing a sudden increase or decrease in the number or % of users retained (or lost— known as churn)? This could be indicative of market factors like a competing product launch, or the effect of product improvements.
Task success
Measuring Task Success requires defining what tasks you are hoping to enable your users to accomplish. Any product may support a number of user workflows. Which ones are important to measure? The answer to that question can hinge on which users activity drives business outcomes, or promotes user engagement. For an eCommerce product, the answer may be simple— which tasks lead to successful product purchases.
- Efficiency (how long does it take to complete a task— typically compared to some benchmark)
- Effectiveness (what % of tasks are successfully completed)
- Error rate— what % or number of tasks cannot be completed due to user error or system failure?
Depending on the product type— and the team’s goals—you may want to measure different things, or measure in different ways. For a product like TurboTax, used only once a year during tax filing season, monthly engagement metrics may not be that meaningful. And retention for a product of that type may be measured over many years, not weeks or months.
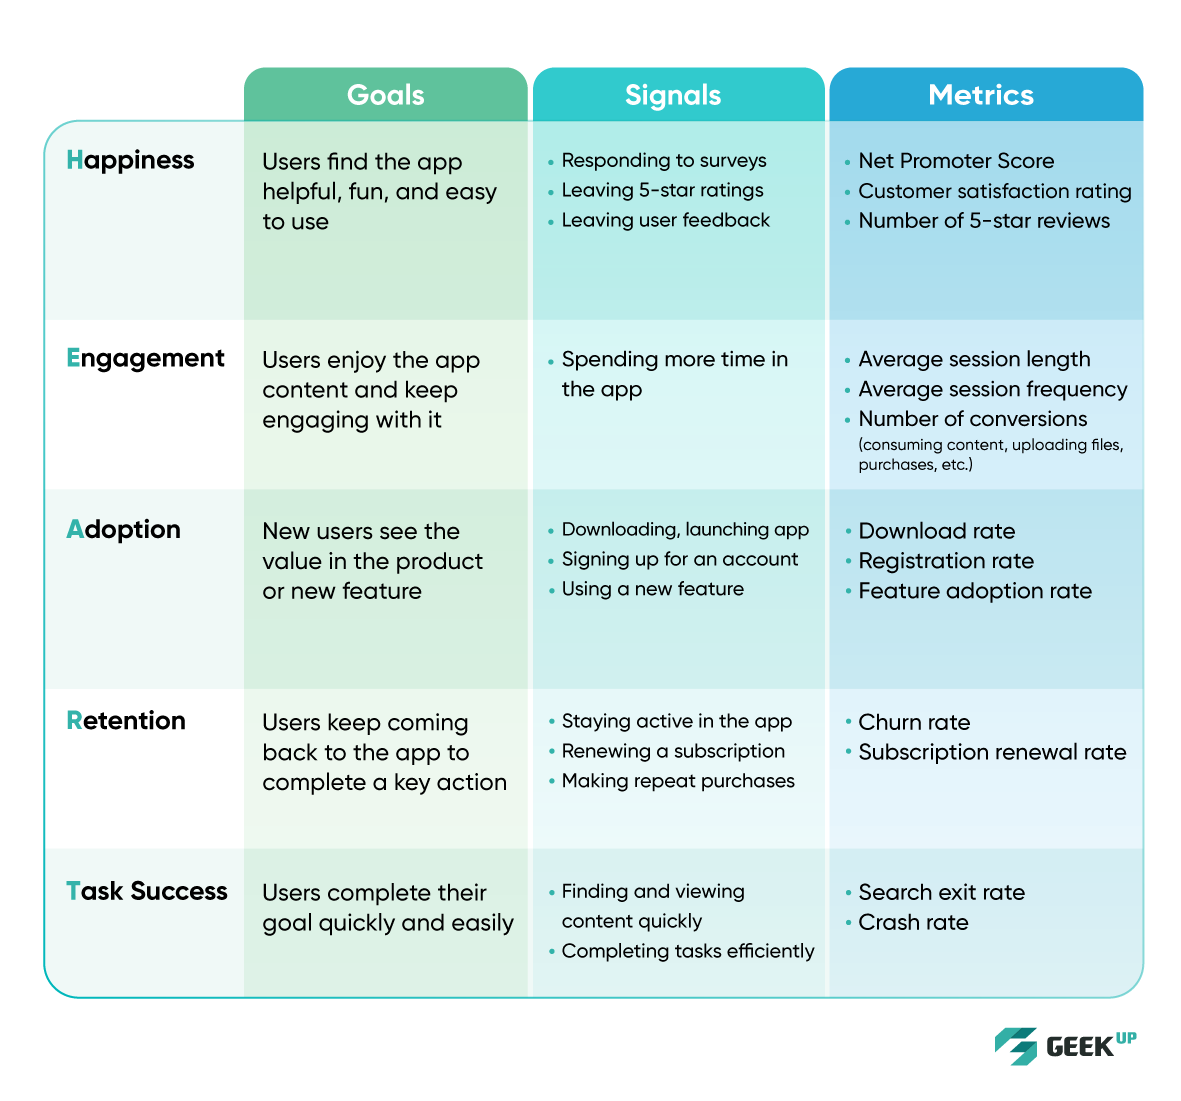
Google’s HEART framework for product metrics
Image credit: GEEK Up
Goals-Signals-Metrics (GSM)
Developed by the creators of HEART, GSM is a complement to that framework. Although HEART gets most of the attention, it achieves business value when the two models are used in conjunction. The folks at Userpilot observe that combining the HEART framework with the GSM process helps you develop user-centered metrics. They describe GSM as a process of “outlining the goals of a product or feature, identifying signals of success, and then building metrics to track” them.
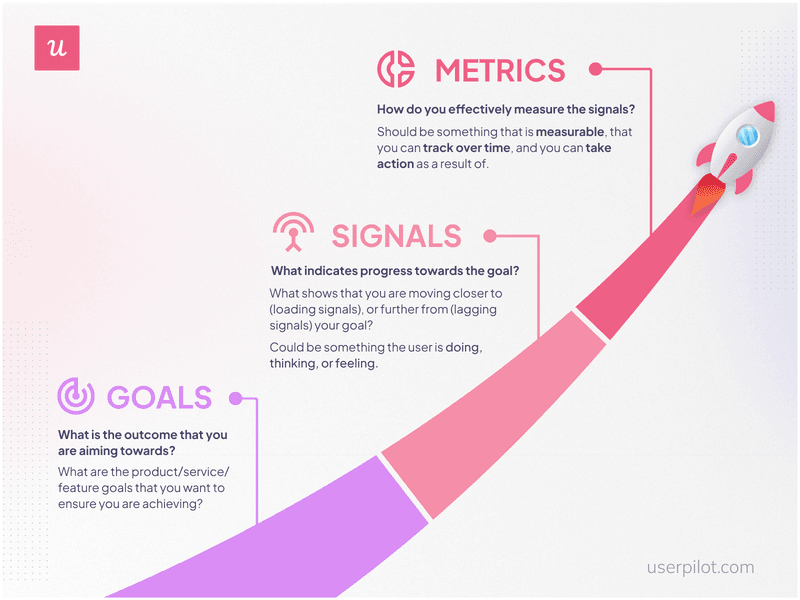
Goal-signals-metric process
Image credit: Userpilot
GSM connects the HEART model to measures of a product’s business value, since satisfied customers are often key to a product’s success in the market:
- Happy, motivated customers who endorse and recommend a product extend the pool of potential new customers, since well-reviewed products have greater visibility in product searches and app marketplaces.
- High numbers of users adopting the product generate revenue via initial purchases, subscriptions and upgrades.
- High customer retention drives increased renewal rates and repeat purchases, resulting in higher revenue and customer lifetime value (CLV).
Outcome-based metrics
We discussed above why an outcome-based approach beats an output-based one. How can you put an outcome-based metrics approach to work in your team?
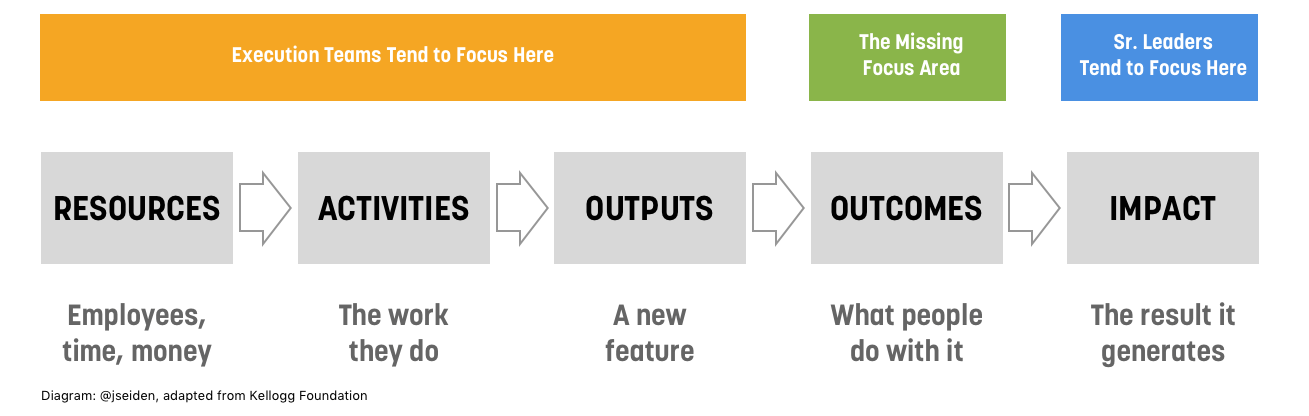
The Project Logic Model, adapted from Kellogg Foundation
Image credit: Josh Seiden via Intercom
Starting with a desired business goal requires working backwards. Referencing the diagram above, Josh Seiden suggests starting with a specific impact you’re hoping to achieve with your product or service.
An impact could be something like increase the number of paid customers on our platform by 20%. To achieve that goal, your team would need to analyze what is likely to motivate your free users to level-up to your paid tier, and what might prevent them from doing so.
What measurable outcome might they want to track, to see if they are achieving the impact target? Maybe, the percentage of users upgrading to premium tier per month, to see whether product improvements they make cause that metric to trend up.
Implementing product analytics
Preparing your team: culture and mindset
Not every team is open to letting data drive their decisions. In plenty of organizations gut-feel and top-down decision-making still prevail. Teams like these tend to be inadequately mindful about why they make the decisions they do. This can give rise to what’s known as a “Feature Factory” mindset, described by Josh Cutler as a business focused on building features rather than solving problems for customers:
- The product team measures its success by how much and often it ships.
- The company believes that adding a new feature always adds value to the product.
- The organization fails to test feature ideas before building them and fails to assess its success with users after the features ship.
If that sounds familiar to you, nudging your team to a more hypothesis-driven mindset will go a long way to a healthier, more harmonious and collaborative team dynamic.
Starting simple, as we discussed above, will help. Building on some easy and uncontroversial wins, like getting a baseline understanding of how your product is performing, is an excellent way to introduce your team to the value of a data-informed approach.
Then you can move on to crafting experiments designed to validate your team’s assumptions about what value they think will accrue from a new feature or product modification.
Communicating a product analytics approach within the organization and engaging your team in the process
Having real impact with a product analytics program hinges on getting buy-in from your team and your other key stakeholders, particularly partners who may have a vested interest in a non-data driven decision process. We’ve seen success when teams have been able to cultivate, or further enhance a spirit of collaborative innovation and intellectual curiosity. Can you make this a team project and a shared organizational value?
After all, wouldn’t it be great to be able to improve your business by systematically identifying gaps in how your product is performing? Then ideating potential solutions, experimenting, evaluating how things go and continually improving?
Wouldn’t it be nice to de-politicize and de-stress your product decision-making process?
Product analytics can help you better understand the behavior of your customer, enabling your team to make data-informed decisions about which opportunities to invest in to improve your customer’s experience.
It can help your team avoid the most common Product Experience issues, such as poor onboarding, lackluster engagement, and low retention. If your team is new to collecting data, consider leveraging existing frameworks (HEART and Goals-Signals-Metrics, Outcome-Based Metrics) and introduce your team to the value they can provide as you work to transform your organization’s mindset.